The Cost of Two Versions of the Truth
It’s Monday morning and the leadership team is going through the monthly numbers.
Marketing kicks off. “We acquired 12,400 new customers last month.”
Finance doesn’t flinch. “We have 9,100. That’s the number we’re using.”
Now the conversation changes. Instead of talking about growth, everyone is trying to answer a different set of questions. Which report is the real one? What exactly counts as a customer? Why do two dashboards disagree?
This is the Data Discrepancy Tax. It shows up as wasted meeting time, slower decisions, and a quiet loss of trust in analytics. Once leaders start double-checking every chart, data stops helping and starts getting in the way.
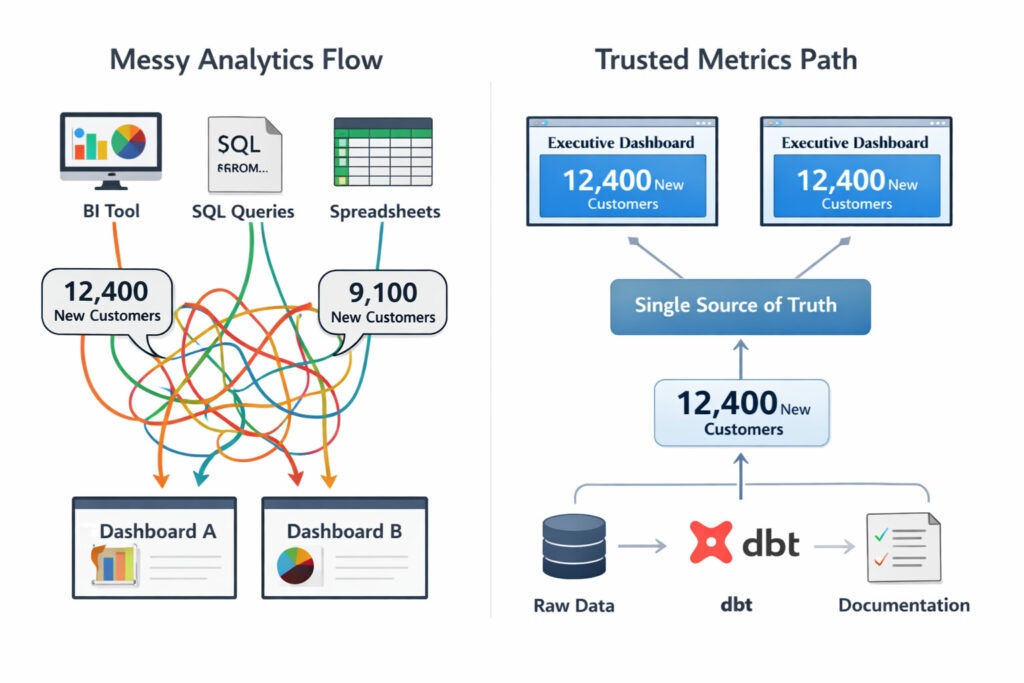
Most of the time, nobody did anything wrong. The logic behind the numbers is simply scattered across dashboards, one-off SQL queries, and spreadsheets. That is how you end up with two versions of the truth.
When Marketing and Finance bring different numbers to the same meeting, trust in analytics drops fast and decisions slow down. The issue is usually scattered logic across tools, not lack of effort.
The Scaling Wall: When Scrappy Data Stops Working
In early-stage growth, analytics is naturally scrappy. A few dashboards, some key SQL queries, and a spreadsheet or two can be enough.
Then the business scales and the same metrics start showing up everywhere: pipeline reviews, finance forecasts, board decks, and customer reporting. That’s when cracks appear.
What usually changes is not the tools. It’s the process.
- Logic gets copied and pasted across reports
- Definitions drift between teams
- Small changes break dashboards in surprising ways
- Analysts spend more time reconciling numbers than producing insights
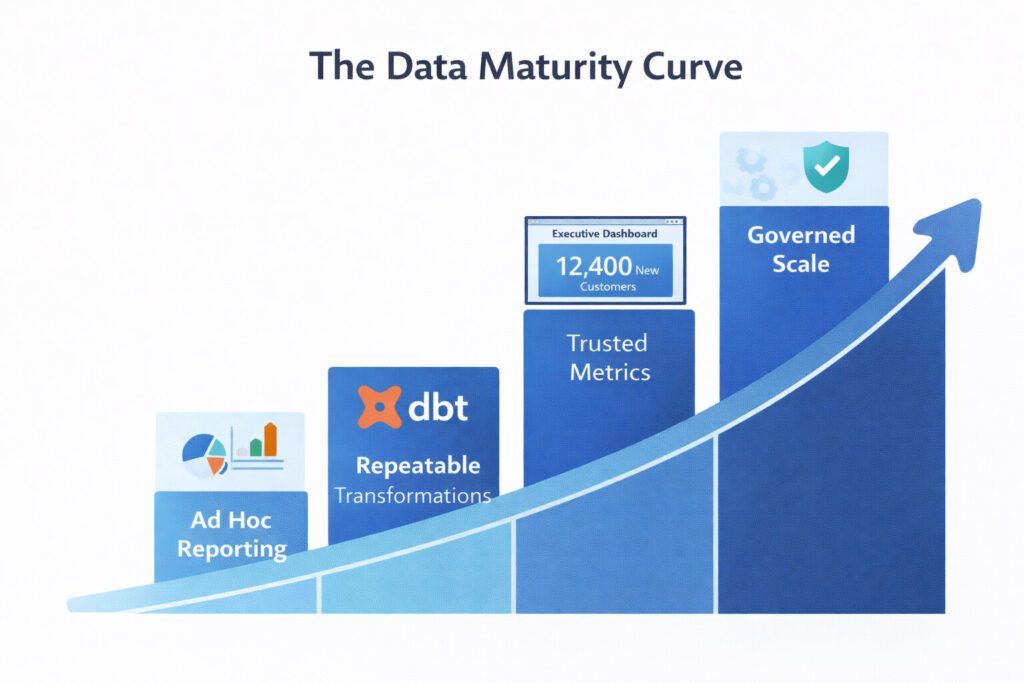
This is the scaling wall. Data stops feeling like a shared asset and starts creating friction.
At this stage, the winning move is to standardize how metrics are defined and maintained so leaders can trust the numbers and teams can move faster without breaking things.
Scrappy reporting works early, but it breaks when multiple teams depend on the same metrics. Without a repeatable process, definitions drift, dashboards get fragile, and analysts spend their time reconciling instead of informing.
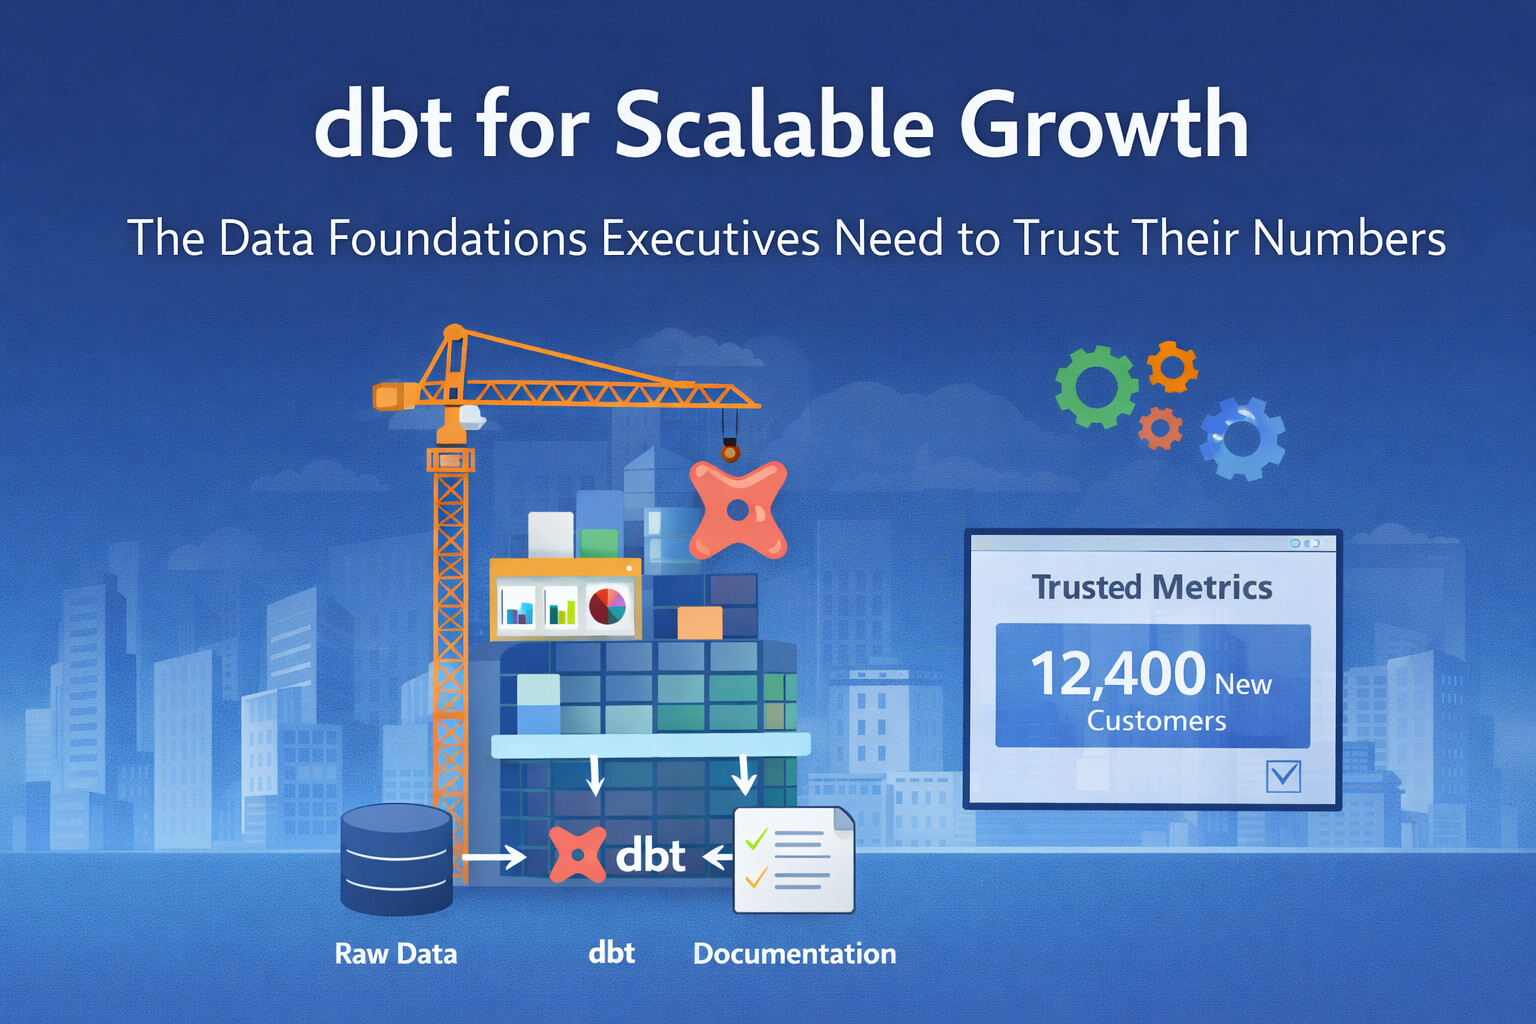
What Is dbt? Think of It as Building Code for Your Data
Most companies do not have a data problem. They have a consistency problem.
Raw data is coming in from your product, your CRM, your billing system, and your marketing tools. The hard part is turning all of that into clean, reliable metrics that everyone agrees on.
That is where dbt fits.
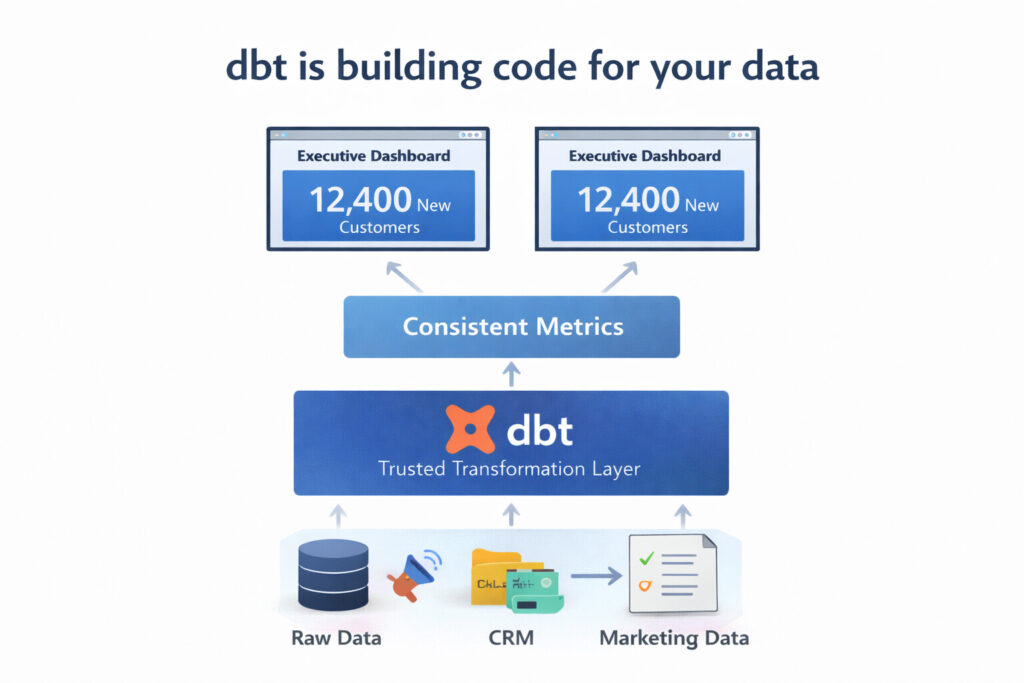
A simple way to think about dbt is this: dbt is building code for your data. It is the set of standards that makes sure your “data building” is safe, consistent, and easy to maintain as you grow.
Without standards, each dashboard or report can end up doing its own thing. With dbt, you define the business logic once and reuse it everywhere.
It creates a clear middle layer between raw data and the dashboards executives look at. That middle layer is where definitions live, where checks happen, and where changes can be made safely.
dbt is building code for your data, a set of standards that turns raw data into consistent, reusable metrics. It creates a trusted middle layer between your warehouse and the dashboards executives rely on.
The Three Pillars of Executive Value
dbt is not about making data “fancier”. It’s about making it dependable. For an executive team, the value usually shows up in three simple ways.
Absolute Trust (Reliability)
dbt lets teams add automated checks to critical metrics. If something breaks or a number looks wrong, it gets flagged early, before it shows up in a dashboard or a board deck. Less surprises, fewer fire drills.
Institutional Memory (Documentation)
In many companies, key metrics live in someone’s head or inside a dashboard no one wants to touch. dbt encourages teams to write down what a metric means and how it is built. When someone leaves, the logic stays. That reduces key person risk.
Velocity (Speed to Insight)
When definitions are centralized, teams stop rebuilding the same logic over and over. You create reusable building blocks and move faster without cutting corners. That means quicker answers to business questions and less time spent on rework.
dbt delivers trust, documentation, and speed. It catches issues earlier, preserves metric logic as institutional knowledge, and helps teams answer questions faster by reusing shared building blocks.
Managing Expectations: What dbt Is Not
dbt is powerful, but it helps to be clear about what it does and does not do.
dbt is not a dashboard tool. It will not replace Looker, Power BI, or Tableau.
It is not an ingestion tool either. It does not pull data from your apps into the warehouse.
And it is not a magic wand that fixes bad data overnight.
What dbt does is more foundational. It gives you a clean, consistent way to turn raw data into trusted metrics, with clear definitions and guardrails. When teams treat that layer seriously, the dashboards on top get better almost automatically.
dbt is not a dashboard tool, not an ingestion tool, and not a magic fix overnight. It’s the foundation that makes downstream dashboards and reporting more consistent and reliable.
The ROI: Turning Data Into a Profit Center
dbt pays off in two ways that executives care about: time and risk.
First, it reduces the day-to-day waste. When teams are constantly reconciling numbers, you are paying for the same work twice. Analysts burn time rebuilding logic, leaders burn time debating it, and everyone moves slower. A trusted transformation layer cuts that noise down.
Second, it lowers the cost of bad decisions. When metrics are inconsistent, it is easy to over-invest in the wrong channel, misread churn, or miss a forecast. You may never label those as “data costs,” but they show up on the P and L.
The goal is not to build perfect data. The goal is to build data you can trust enough to move faster.
That is how data stops being overhead and starts becoming leverage.
dbt reduces wasted time spent reconciling numbers and lowers the risk of expensive decisions made on inconsistent metrics. The result is faster execution with more confidence in what the data is saying.
Conclusion: The Next Step for a Data-Driven Culture
Scaling is a choice.
You can keep adding dashboards and hope the numbers stay consistent, or you can invest in the foundation that makes consistency the default.
dbt is a practical step in that direction. It helps teams define metrics once, keep them reliable, and reuse them across the business as you grow.
A simple next move is to start small. Pick one or two metrics leadership cares about most, standardize the definitions, and prove the value quickly. From there, you can expand with confidence.
You can scale the chaos, or you can scale the foundation.
Start small by standardizing one or two executive-critical metrics and proving reliability quickly. From there, you can scale a foundation that supports growth instead of scaling chaos.